Economists from the Reserve Bank of India (RBI) have recently updated India’s poverty estimates using the Household Consumption Expenditure Survey (HCES) 2022–23, applying the Rangarajan Committee (2014) framework — India’s last official benchmark for poverty measurement.
This update provides a fresh picture of poverty reduction and inequality across Indian states.
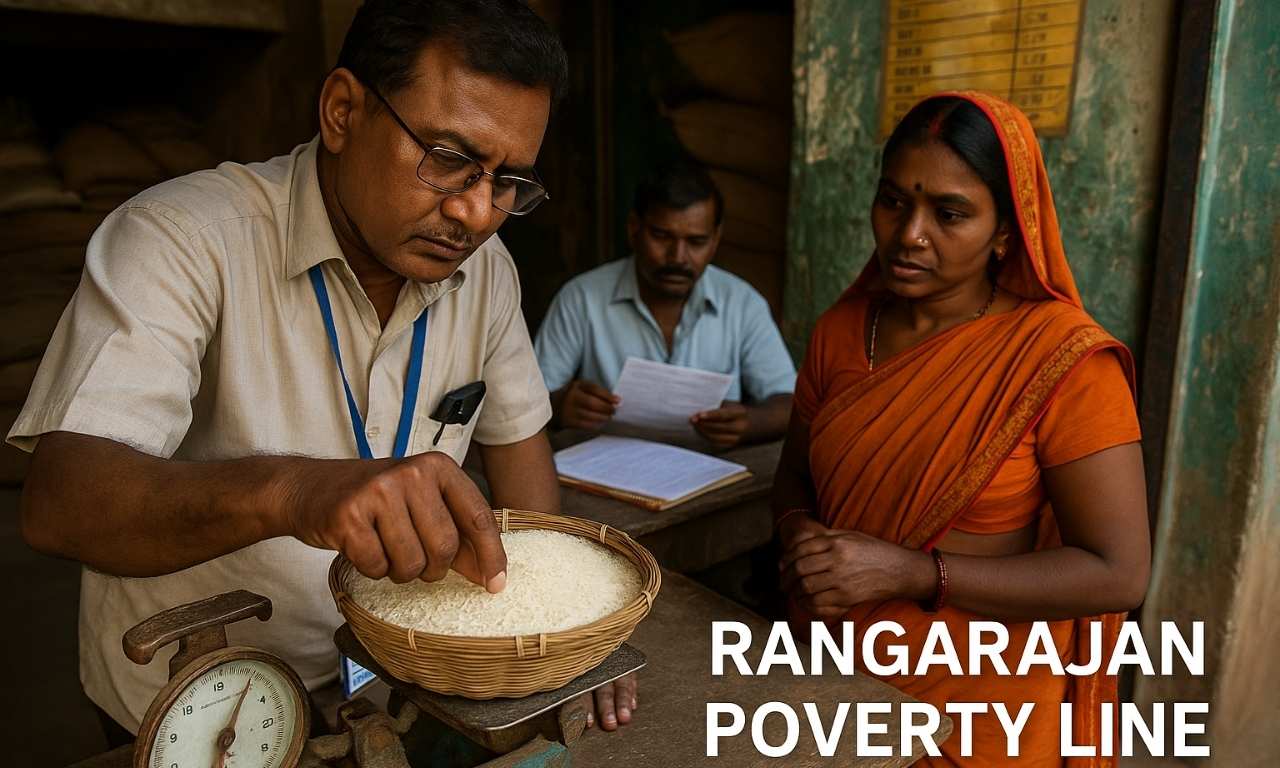
C. Rangarajan Committee on Poverty Estimation
- Constitution: Formed in 2012 by the Planning Commission, chaired by Dr. C. Rangarajan, former Governor of the RBI.
- Purpose: To create a more comprehensive and realistic measure of poverty that included basic needs beyond just food.
- Report Submitted: June 2014, marking a shift from calorie-based to expenditure-based poverty assessment.
Key Features of the Rangarajan Committee Approach
- Broader Definition of Poverty:
- Included expenses on food, clothing, housing, education, and healthcare.
- Moved beyond the earlier calorie-intake method used by the Tendulkar Committee (2009).
- Poverty Line (2011–12):
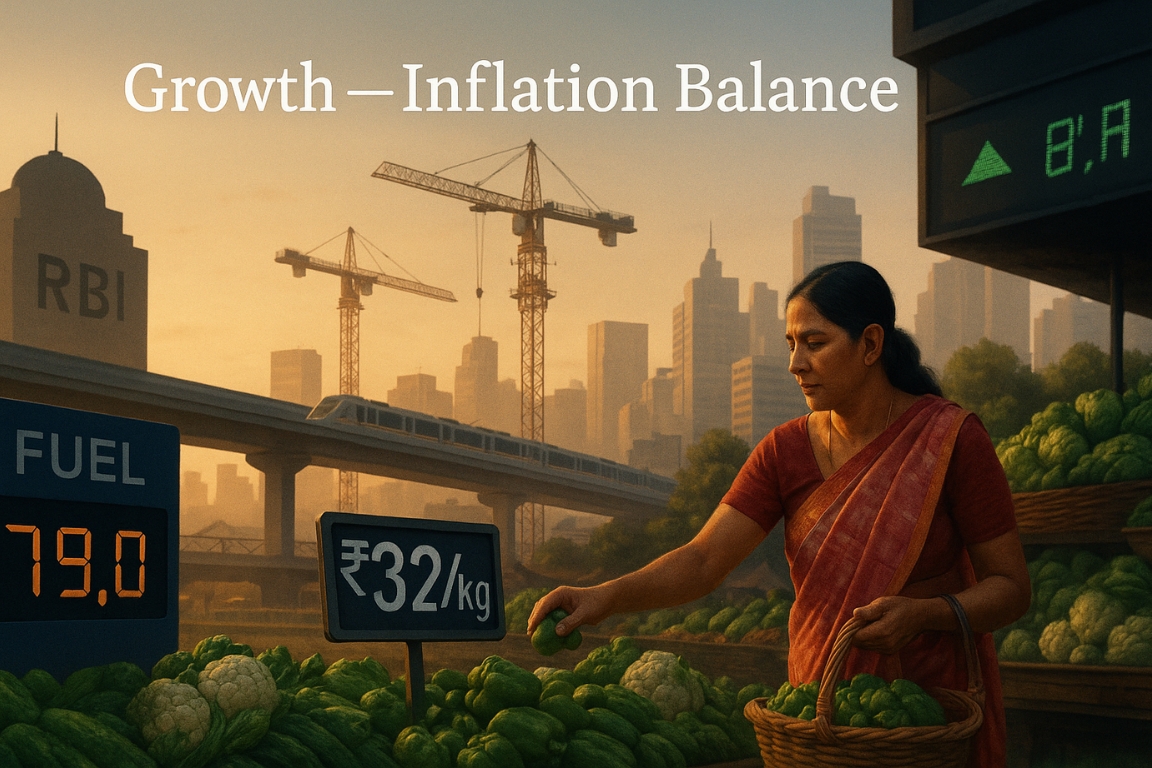
- Rural: ₹972 per person per month (~₹32/day)
- Urban: ₹1,407 per person per month (~₹47/day)
- Methodology:
- Based on Monthly Per Capita Expenditure (MPCE) using Modified Mixed Reference Period (MMRP) data.
- Created separate consumption baskets for rural and urban areas.
- Adjusted for state-wise price variations.
- Findings (2011–12):
- 29.5% of India’s population lived below the poverty line.
RBI’s 2025 Update (DEPR Study)
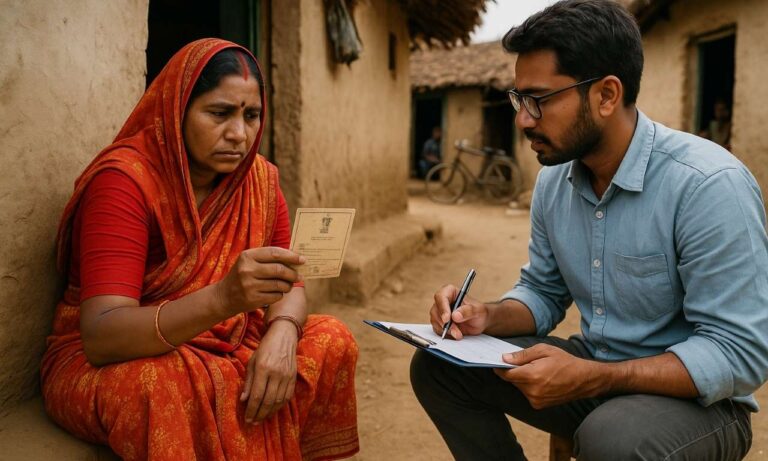
- RBI’s Department of Economic & Policy Research (DEPR) used new HCES 2022–23 data covering 20 states.
- Continued the Rangarajan methodology with updated price and consumption data.
- New Index: Developed a Poverty Line Basket (PLB) Index, considered more accurate than the Consumer Price Index (CPI).
- Food Share in PLB:
- Rural: 57% (vs 54% in CPI)
- Urban: 47% (vs 36% in CPI)
Major Findings (RBI Study)
- Sharp Poverty Reduction:
- Rural Odisha: 47.8% → 8.6%
- Urban Bihar: 50.8% → 9.1%
- Lowest Poverty: Himachal Pradesh (0.4% rural), Tamil Nadu (1.9% urban)
- Highest Poverty: Chhattisgarh (25.1% rural, 13.3% urban)
Significance
- Confirms a broad-based fall in poverty across most Indian states.
- Highlights persistent regional disparities requiring targeted welfare policies.
- Strengthens the argument for a new official poverty line reflecting modern consumption patterns and updated living costs.
This topic is available in detail on our main website.